R
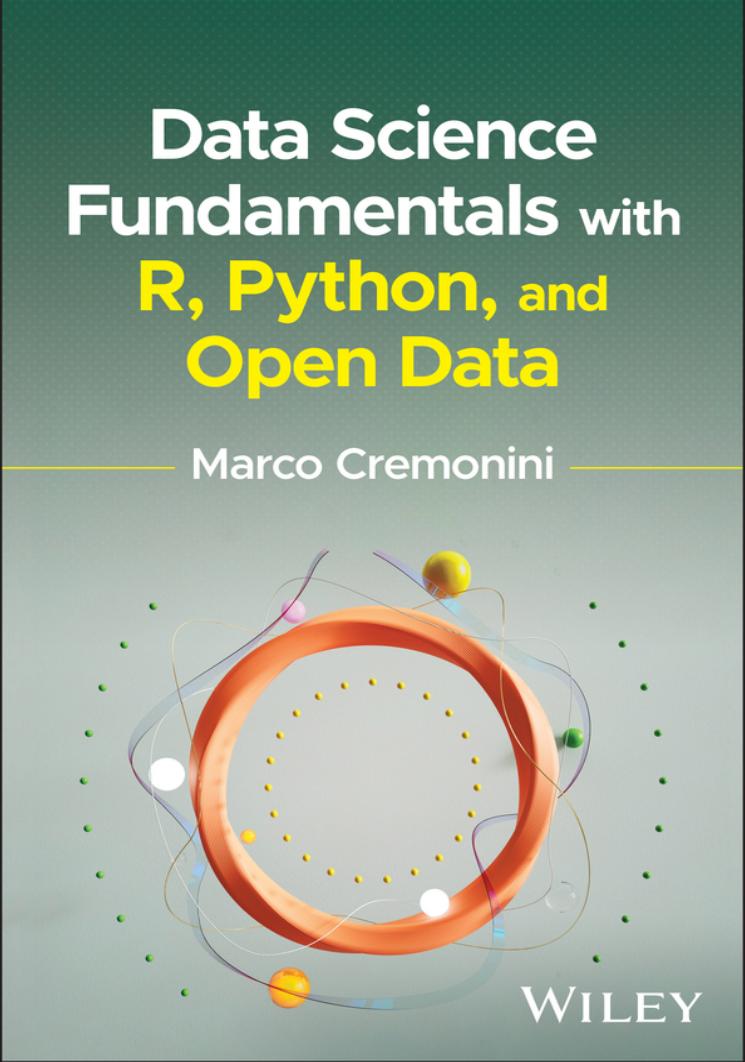
Data Science Fundamentals with R, Python, and Open Data - Marco Cremonini
Organized with a strong focus on open data, Data Science Fundamentals with R, Python, and Open Data discusses concepts, techniques, tools, and first steps to carry out data science projects, with a focus on Python and RStudio, reflecting a clear industry trend emerging towards the integration of the two. The text examines intricacies and inconsistencies often found in real data, explaining how to recognize them and guiding readers through possible solutions, and enables readers to handle real data confidently and apply transformations to reorganize, indexing, aggregate, and elaborate.
This book is full of reader interactivity, with a companion website hosting supplementary material including datasets used in the examples and complete running code (R scripts and Jupyter notebooks) of all examples. Exam-style questions are implemented and multiple choice questions to support the readers’ active learning. Each chapter presents one or more case studies.
Written by a highly qualified academic, Data Science Fundamentals with R, Python, and Open Data discuss sample topics such as:
- Data organization and operations on data frames, covering reading CSV dataset and common errors, and slicing, creating, and deleting columns in R
- Logical conditions and row selection, covering selection of rows with logical condition and operations on dates, strings, and missing values
- Pivoting operations and wide form-long form transformations, indexing by groups with multiple variables, and indexing by group and aggregations
- Conditional statements and iterations, multicolumn functions and operations, data frame joins, and handling data in list/dictionary format
Data Science Fundamentals with R, Python, and Open Data is a highly accessible learning resource for students from heterogeneous disciplines where Data Science and quantitative, computational methods are gaining popularity, along with hard sciences not closely related to computer science, and medical fields using stochastic and quantitative models.
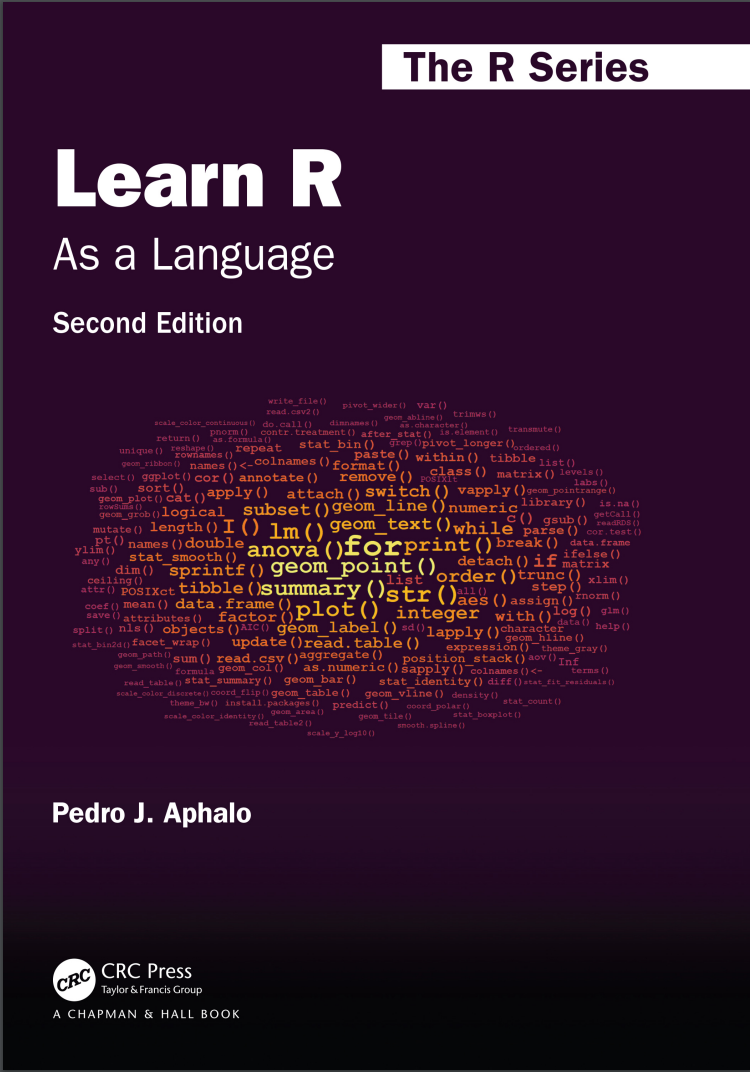
Learn R: As a Language. 2 Ed - Pedro J. Aphalo
Learning a computer language like R can be either frustrating, fun, or boring. Having fun requires challenges that wake up the learner’s curiosity but also provide an emotional reward on overcoming them. This book is designed so that it includes smaller and bigger challenges, in what I call playgrounds, in the hope that all readers will enjoy their path to R fluency. Fluency in the use of a language is a skill that is acquired through practice and exploration. Although rarely mentioned separately, fluency in a computer programming language involves both writing and reading. The parallels between natural and computer languages are many, but differences are also important. For students and professionals in the biological sciences, humanities, and many applied fields, recognizing the parallels between R and natural languages should help them feel at home with R. The approach I use is similar to that of a travel guide, encouraging exploration and describing the available alternatives and how to reach them. The intention is to guide the reader through the R landscape of 2020 and beyond.
Features
- R as it is currently used
- Few prescriptive rules―mostly the author’s preferences together with alternatives
- Explanation of the R grammar emphasizing the "R way of doing things"
- Tutoring for "programming in the small" using scripts
- The grammar of graphics and the grammar of data described as grammars
- Examples of data exchange between R and the foreign world using common file formats
- Coaching for becoming an independent R user, capable of both writing original code and solving future challenges
- What makes this book different from others:
- Tries to break the ice and help readers from all disciplines feel at home with R
- Does not make assumptions about what the reader will use R for
- Attempts to do only one thing well: guide readers into becoming fluent in the R language

Алгоритмы и структуры для массивных наборов данных - Джейла Меджедович, Инес Дедович, Эмин Тахирович
Стандартные алгоритмы и структуры при применении к крупным распределенным наборам данных могут становиться медленными — или вообще не работать. Правильный подбор алгоритмов, предназначенных для работы с большими данными, экономит время, повышает точность и снижает стоимость обработки. Книга знакомит с методами обработки и анализа больших распределенных данных. Насыщенное отраслевыми историями и занимательными иллюстрациями, это удобное руководство позволяет легко понять даже сложные концепции. Вы научитесь применять на реальных примерах такие мощные алгоритмы, как фильтры Блума, набросок count-min, HyperLogLog и LSM-деревья, в своих собственных проектах.
Приведены примеры на Python, R и в псевдокоде.
Основные темы:
- вероятностные структуры данных в виде набросков;
- выбор правильного движка базы данных;
- конструирование эффективных дисковых структур данных и алгоритмов;
- понимание алгоритмических компромиссов в крупно-масштабных системах;
- правильное формирование выборок из потоковых данных;
- вычисление процентилей при ограниченных пространственных ресурсах.
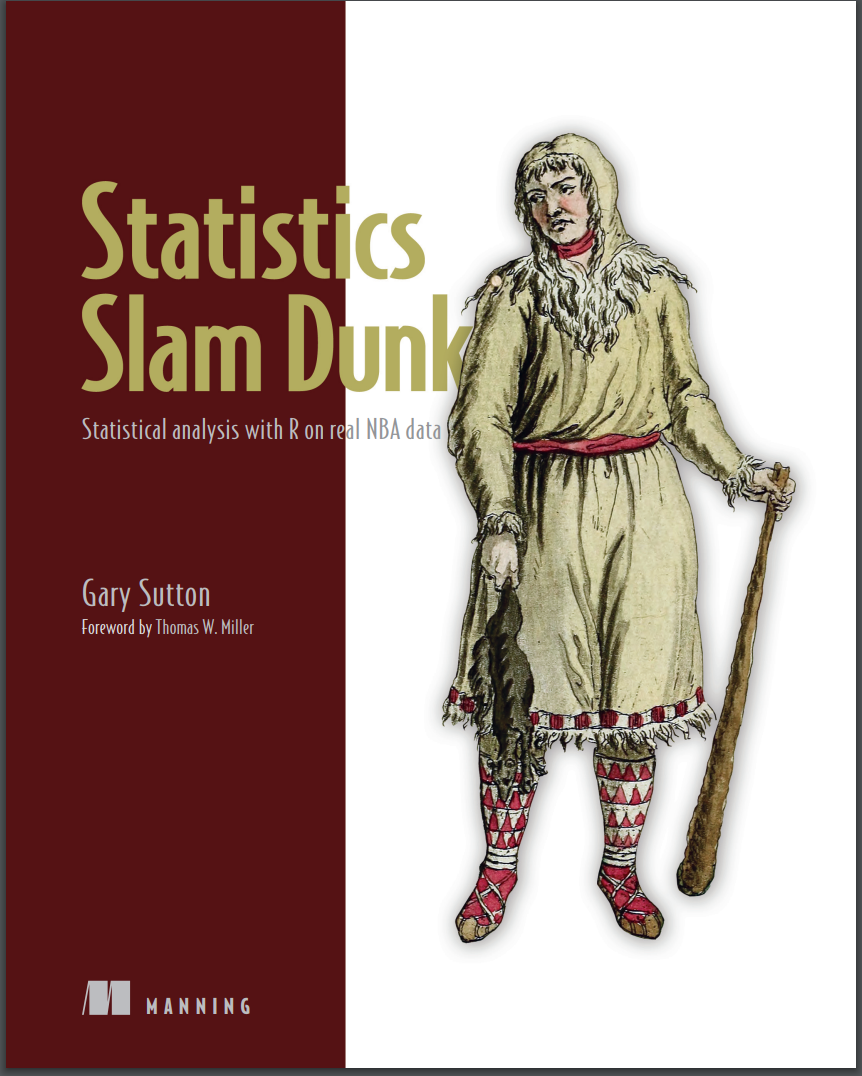
Statistics Slam Dunk - Gary Sutton
Statistics Slam Dunk is a data science manual with a difference. Each chapter is a complete, self-contained statistics or data science project for you to work through—from importing data, to wrangling it, testing it, visualizing it, and modeling it. Throughout the book, you’ll work exclusively with NBA data sets and the R language, applying best-in-class statistics techniques to reveal fun and fascinating truths about the NBA.
About the book
Is losing basketball games on purpose a rational strategy? Which hustle statistics have an impact on wins and losses? Does spending more on player salaries translate into a winning record? You’ll answer all these questions and more. Plus, R’s visualization capabilities shine through in the book’s 300 plots and charts, including Pareto charts, Sankey diagrams, Cleveland dot plots, and dendrograms.
What's inside
- Transforming, tidying, and wrangling data
- Applying best-in-class exploratory data analysis techniques
- Developing supervised and unsupervised machine learning algorithms
- Executing hypothesis tests and effect size tests
About the reader
For readers who know basic statistics. No advanced knowledge of R—or basketball—required.
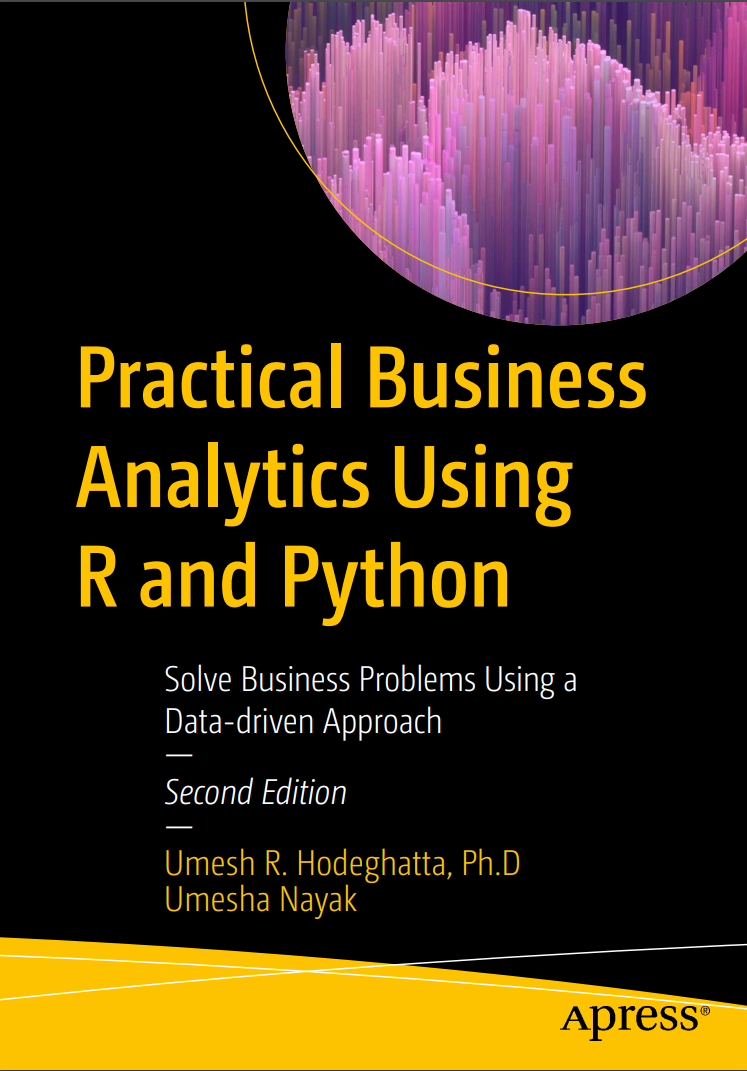
Practical Business Analytics Using R and Python. 2 Ed - Umesha Nayak, Umesh Hodeghatta Rao
This book illustrates how data can be useful in solving business problems. It explores various analytics techniques for using data to discover hidden patterns and relationships, predict future outcomes, optimize efficiency and improve the performance of organizations. You’ll learn how to analyze data by applying concepts of statistics, probability theory, and linear algebra. In this new edition, both R and Python are used to demonstrate these analyses. Practical Business Analytics Using R and Python also features new chapters covering databases, SQL, Neural networks, Text Analytics, and Natural Language Processing.
Part one begins with an introduction to analytics, the foundations required to perform data analytics, and explains different analytics terms and concepts such as databases and SQL, basic statistics, probability theory, and data exploration. Part two introduces predictive models using statistical machine learning and discusses concepts like regression, classification, and neural networks. Part three covers two of the most popular unsupervised learning techniques, clustering and association mining, as well as text mining and natural language processing (NLP). The book concludes with an overview of big data analytics, R and Python essentials for analytics including libraries such as pandas and NumPy.
Upon completing this book, you will understand how to improve business outcomes by leveraging R and Python for data analytics.
What You Will Learn
- Master the mathematical foundations required for business analytics
- Understand various analytics models and data mining techniques such as regression, supervised machine learning algorithms for modeling, unsupervised modeling techniques, and how to choose the correct algorithm for analysis in any given task
- Use R and Python to develop descriptive models, predictive models, and optimize models
- Interpret and recommend actions based on analytical model outcomes
Who This Book Is For
Software professionals and developers, managers, and executives who want to understand and learn the fundamentals of analytics using R and Python.
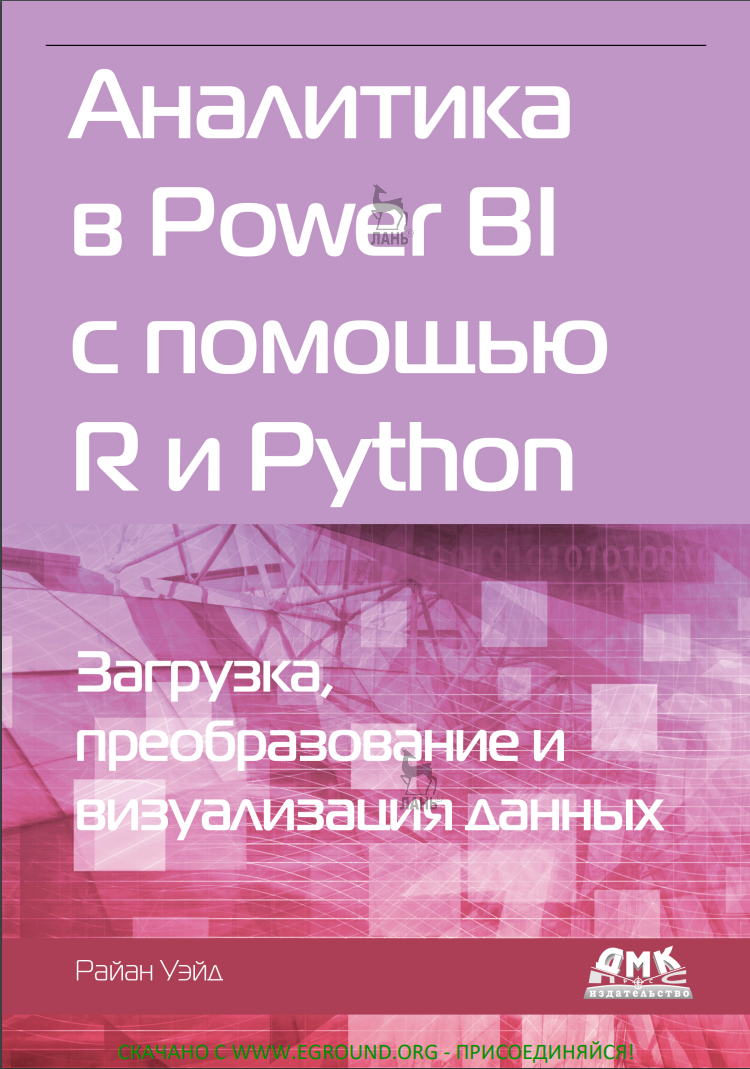
Аналитика в Power BI с помощью R и Python - Райан Уэйд
Данная книга поможет вам научиться использовать языки программирования R и Python в аналитике совместно с Microsoft Power BI. Эксперт в области анализа данных и автор книги Райан Уэйд продемонстрирует на примерах, как можно легко и просто применить R и Python там, где стандартных средств Power BI просто недостаточно. Помимо прочего, вы научитесь анализировать данные в Power BI с применением пользовательских моделей машинного обучения и мощных моделей из состава службы Microsoft Cognitive Services.
Языки R и Python стоит рассматривать в качестве полезного дополнения к Power BI. С их помощью можно проводить углубленный анализ и преобразование исходных данных с использованием техник, недоступных для стандартных средств Power BI.
Если вы являетесь бизнес-аналитиком, специалистом в области науки о данных и хотите превратить Power BI из обычного инструмента в полноценную систему для всестороннего анализа данных, эта книга - для вас!
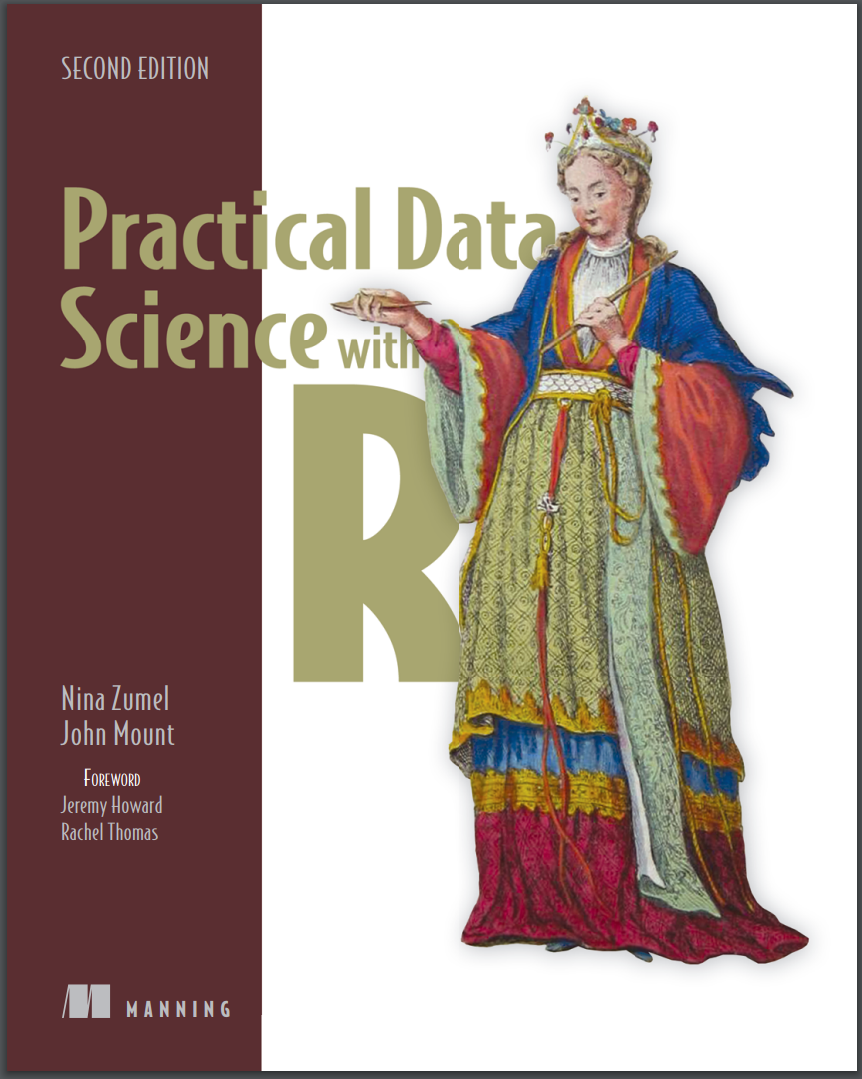
Practical Data Science with R. 2 Ed - John Mount, Nina Zumel
Practical Data Science with R, Second Edition takes a practice-oriented approach to explaining basic principles in the ever expanding field of data science. You’ll jump right to real-world use cases as you apply the R programming language and statistical analysis techniques to carefully explained examples based in marketing, business intelligence, and decision support.
Purchase of the print book includes a free eBook in PDF, Kindle, and ePub formats from Manning Publications.
About the technology
Evidence-based decisions are crucial to success. Applying the right data analysis techniques to your carefully curated business data helps you make accurate predictions, identify trends, and spot trouble in advance. The R data analysis platform provides the tools you need to tackle day-to-day data analysis and machine learning tasks efficiently and effectively.
About the book
Practical Data Science with R, Second Edition is a task-based tutorial that leads readers through dozens of useful, data analysis practices using the R language. By concentrating on the most important tasks you’ll face on the job, this friendly guide is comfortable both for business analysts and data scientists. Because data is only useful if it can be understood, you’ll also find fantastic tips for organizing and presenting data in tables, as well as snappy visualizations.
What's inside
- Statistical analysis for business pros
- Effective data presentation
- The most useful R tools
- Interpreting complicated predictive models
About the reader
You’ll need to be comfortable with basic statistics and have an introductory knowledge of R or another high-level programming language.

R в действии. 3 изд - Роберт И. Кабаков
R – золотой стандарт, ежедневно используемый исследователями по всему миру для самых разных вычислений и статистического анализа данных. Этот свободно распространяемый язык с открытым исходным кодом включает огромное количество пакетов самой разной направленности, от расширенной визуализации данных до глубокого обучения. Чрезвычайно удобный для пользователей с математическим складом ума, R легко решает практические задачи, не заставляя думать о них с точки зрения программиста. Данная книга научит вас выполнять статистический анализ и визуализировать результаты с помощью R и его популярных пакетов; решать такие практические задачи, как прогнозирование, интеллектуальный анализ данных и разработка динамических отчетов. В обновленное третье издание добавлены новые сведения о построении диаграмм с помощью пакета ggplot2, а также приводятся примеры из области машинного обучения, такие как кластеризация, классификация и анализ временных рядов.
Издание предназначено для всех, кто имеет дело с обработкой данных. Опыт в программировании статистических методов не требуется, достаточно базовых знаний математики и статистики.
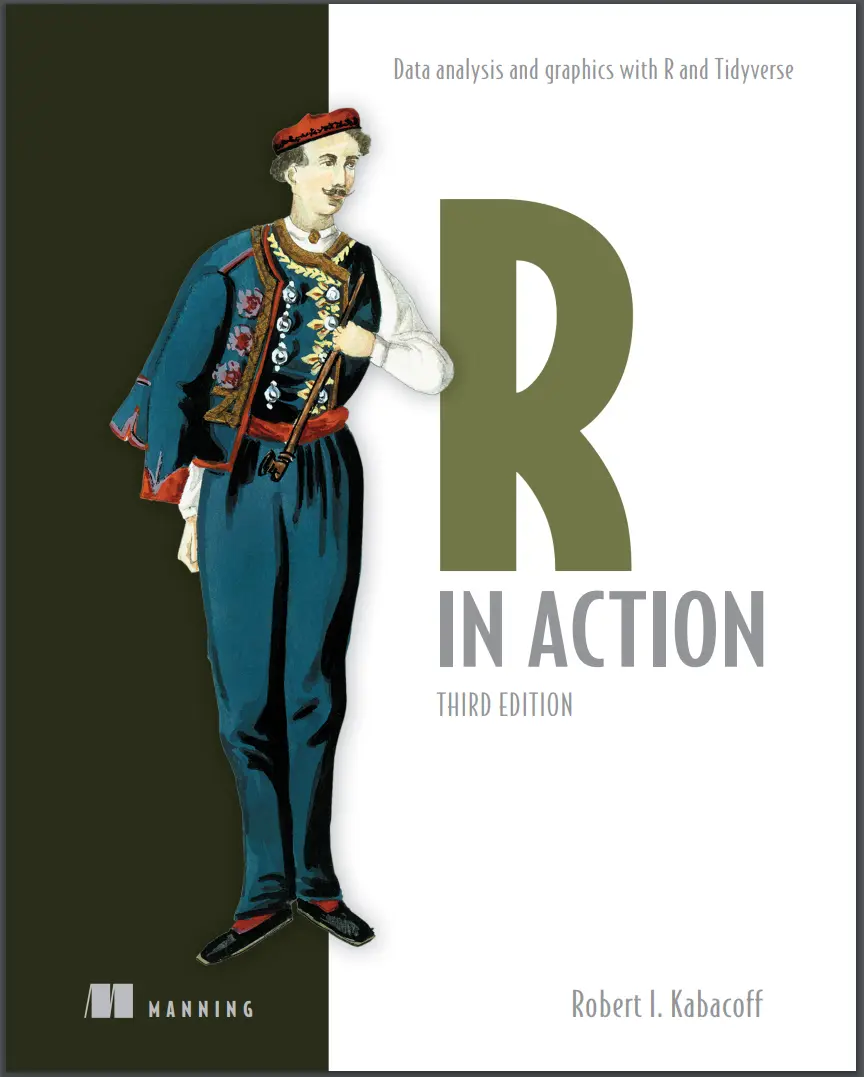
R in Action. 3 Ed - Robert I. Kabacoff
R in Action, Third Edition makes learning R quick and easy. That’s why thousands of data scientists have chosen this guide to help them master the powerful language. Far from being a dry academic tome, every example you’ll encounter in this book is relevant to scientific and business developers, and helps you solve common data challenges. R expert Rob Kabacoff takes you on a crash course in statistics, from dealing with messy and incomplete data to creating stunning visualizations. This revised and expanded third edition contains fresh coverage of the new tidyverse approach to data analysis and R’s state-of-the-art graphing capabilities with the ggplot2 package.
Purchase of the print book includes a free eBook in PDF, Kindle, and ePub formats from Manning Publications.
About the technology
Used daily by data scientists, researchers, and quants of all types, R is the gold standard for statistical data analysis. This free and open source language includes packages for everything from advanced data visualization to deep learning. Instantly comfortable for mathematically minded users, R easily handles practical problems without forcing you to think like a software engineer.
About the book
R in Action, Third Edition teaches you how to do statistical analysis and data visualization using R and its popular tidyverse packages. In it, you’ll investigate real-world data challenges, including forecasting, data mining, and dynamic report writing. This revised third edition adds new coverage for graphing with ggplot2, along with examples for machine learning topics like clustering, classification, and time series analysis.
What's inside
- Clean, manage, and analyze data
- Use the ggplot2 package for graphs and visualizations
- Techniques for debugging programs and creating packages
- A complete learning resource for R and tidyverse
About the reader
Requires basic math and statistics. No prior experience with R needed.
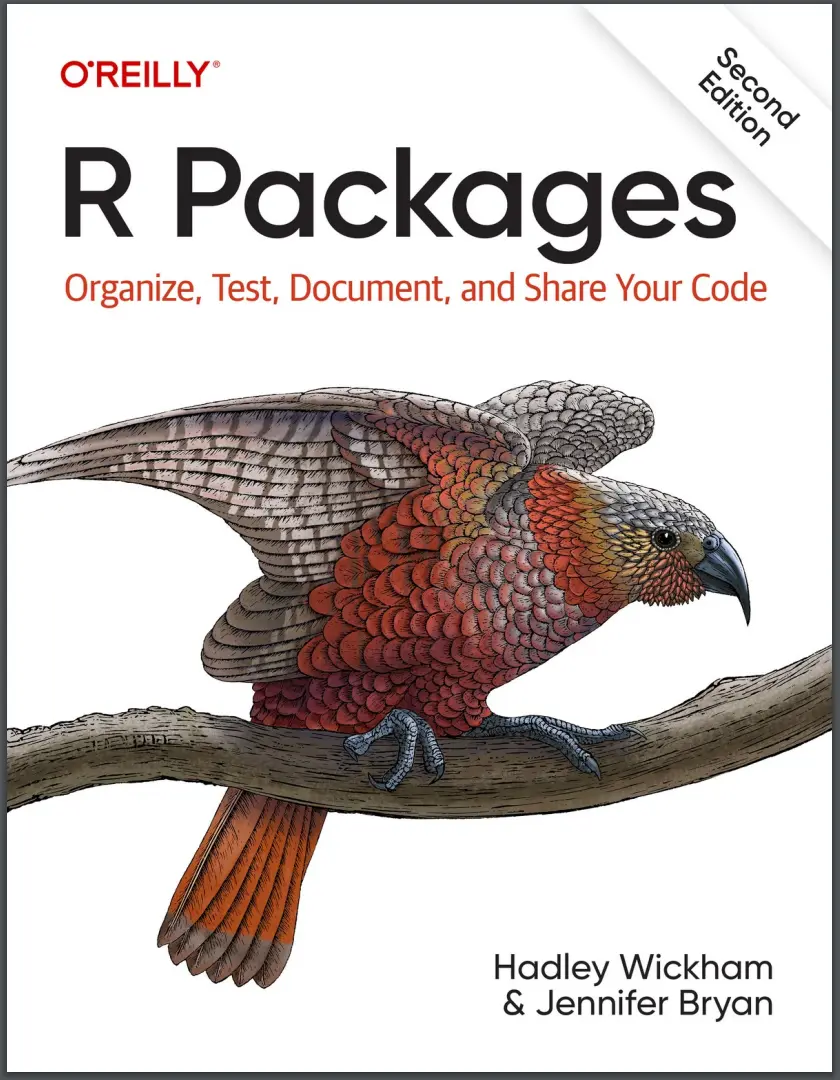
R Packages. 2 Ed - Hadley Wickham, Jennifer Bryan
Turn your R code into packages that others can easily install and use. With this fully updated edition, developers and data scientists will learn how to bundle reusable R functions, sample data, and documentation together by applying the package development philosophy used by the team that maintains the "tidyverse" suite of packages. In the process, you'll learn how to automate common development tasks using a set of R packages, including devtools, usethis, testthat, and roxygen2.
Authors Hadley Wickham and Jennifer Bryan from Posit (formerly known as RStudio) help you create packages quickly, then teach you how to get better over time. You'll be able to focus on what you want your package to do as you progressively develop greater mastery of the structure of a package.
With this book, you will:
- Learn the key components of an R package, including code, documentation, and tests
- Streamline your development process with devtools and the RStudio IDE
- Get tips on effective habits such as organizing functions into files
- Get caught up on important new features in the devtools ecosystem
- Learn about the art and science of unit testing, using features in the third edition of testthat
- Turn your existing documentation into a beautiful and user friendly website with pkgdown
- Gain an appreciation of the benefits of modern code hosting platforms, such as GitHub

Advancing into Analytics: From Excel to Python and R - George Mount
Data analytics may seem daunting, but if you're an experienced Excel user, you have a unique head start. With this hands-on guide, intermediate Excel users will gain a solid understanding of analytics and the data stack. By the time you complete this book, you'll be able to conduct exploratory data analysis and hypothesis testing using a programming language.
Exploring and testing relationships are core to analytics. By using the tools and frameworks in this book, you'll be well positioned to continue learning more advanced data analysis techniques. Author George Mount, founder and CEO of Stringfest Analytics, demonstrates key statistical concepts with spreadsheets, then pivots your existing knowledge about data manipulation into R and Python programming.
This practical book guides you through:
- Foundations of analytics in Excel: Use Excel to test relationships between variables and build compelling demonstrations of important concepts in statistics and analytics
- From Excel to R: Cleanly transfer what you've learned about working with data from Excel to R
- From Excel to Python: Learn how to pivot your Excel data chops into Python and conduct a complete data analysis

Introduction to Data Science: Data Analysis and Prediction Algorithms with R - Rafael A. Irizarry
Introduction to Data Science: Data Analysis and Prediction Algorithms with R introduces concepts and skills that can help you tackle real-world data analysis challenges. It covers concepts from probability, statistical inference, linear regression, and machine learning. It also helps you develop skills such as R programming, data wrangling, data visualization, predictive algorithm building, file organization with UNIX/Linux shell, version control with Git and GitHub, and reproducible document preparation.
This book is a textbook for a first course in data science. No previous knowledge of R is necessary, although some experience with programming may be helpful. The book is divided into six parts: R, data visualization, statistics with R, data wrangling, machine learning, and productivity tools. Each part has several chapters meant to be presented as one lecture.
The author uses motivating case studies that realistically mimic a data scientist’s experience. He starts by asking specific questions and answers these through data analysis so concepts are learned as a means to answering the questions. Examples of the case studies included are: US murder rates by state, self-reported student heights, trends in world health and economics, the impact of vaccines on infectious disease rates, the financial crisis of 2007-2008, election forecasting, building a baseball team, image processing of hand-written digits, and movie recommendation systems.
The statistical concepts used to answer the case study questions are only briefly introduced, so complementing with a probability and statistics textbook is highly recommended for in-depth understanding of these concepts. If you read and understand the chapters and complete the exercises, you will be prepared to learn the more advanced concepts and skills needed to become an expert.
A complete solutions manual is available to registered instructors who require the text for a course.
Практическая статистика для специалистов Data Science. 2 изд - Питер Брюс, Питер Гедек, Эндрю Брюс
Книга рассчитана на специалистов в области Data Science, обладающих некоторым опытом работы с языком программирования R и имеющих предварительное понятие о математической статистике. В ней в удобной и легкодоступной форме представлены ключевые понятия из статистики, которые относятся к науке о данных, а также объяснено, какие понятия важны и полезны с точки зрения науки о данных, какие менее важны, и почему. Подробно раскрыты темы: разведочный анализ данных, распределения данных и выборок, статистические эксперименты и проверка значимости, регрессия и предсказание, классификация, статистическое машинное обучение и обучение без учителя. Во второе издание включены примеры на языке Python, что расширяет практическое применение книги.
R for Data Science. 2 Ed - Garrett Grolemund, Hadley Wickham, Mine Çetinkaya-Rundel
Learn how to use R to turn data into insight, knowledge, and understanding. Ideal for current and aspiring data scientists, this book introduces you to doing data science with R and RStudio, as well as the tidyverse—a collection of R packages designed to work together to make data science fast, fluent, and fun. Even if you have no programming experience, this updated edition will have you doing data science quickly.
You'll learn how to import, transform, and visualize your data and communicate the results. And you'll get a complete, big-picture understanding of the data science cycle and the basic tools you need to manage the details. Each section in this edition includes exercises to help you practice what you've learned along the way.
Updated for the latest tidyverse best practices, new chapters dive deeper into visualization and data wrangling, show you how to get data from spreadsheets, databases, and websites, and help you make the most of new programming tools.
You'll learn how to:
- Visualize-create plots for data exploration and communication of results
- Transform-discover types of variables and the tools you can use to work with them
- Import-get data into R and in a form convenient for analysis
- Program-learn R tools for solving data problems with greater clarity and ease
- Communicate-integrate prose, code, and results with Quarto
/introduction_to_deep_learning_usi_6BRnRqG.jpg)
Introduction to Deep Learning Using R - Taweh Beysolow II
It is assumed that all readers have at least an elementary understanding of statistical or computer programming, specifically with respect to the R programming language. Those who do not will find it much more difficult to follow the sections of this book which give examples of code to use, and it is suggested that they return to this text upon gaining that information.
Understand deep learning, the nuances of its different models, and where these models can be applied.
The abundance of data and demand for superior products/services have driven the development of advanced computer science techniques, among them image and speech recognition. Introduction to Deep Learning Using R provides a theoretical and practical understanding of the models that perform these tasks by building upon the fundamentals of data science through machine learning and deep learning. This step-by-step guide will help you understand the disciplines so that you can apply the methodology in a variety of contexts. All examples are taught in the R statistical language, allowing students and professionals to implement these techniques using open source tools.
What You'll Learn
- Understand the intuition and mathematics that power deep learning models
- Utilize various algorithms using the R programming language and its packages
- Use best practices for experimental design and variable selection
- Practice the methodology to approach and effectively solve problems as a data scientist
- Evaluate the effectiveness of algorithmic solutions and enhance their predictive power
Who This Book Is For
Students, researchers, and data scientists who are familiar with programming using R. This book also is also of use for those who wish to learn how to appropriately deploy these algorithms in applications where they would be most useful.
/mastering_parallel_programming_wit_H0limnw.jpg)
Mastering Parallel Programming with R - Eilidh Troup, Simon R Chapple, Terence Sloan, Thorsten Forster
This book is for the intermediate to advanced-level R developer who wants to understand how to harness the power of parallel computing to perform long running computations and analyze large quantities of data. You will require a reasonable knowledge and understanding of R programming. You should be a sufficiently capable programmer so that you can read and understand lower-level languages, such as C/C++, and be familiar with the process of code compilation. You may consider yourself to be the new breed of data scientist—a skilled programmer as well as a mathematician.
What you need for this book
To run the code in this book, you will require a multicore modern specification laptop or desktop computer. You will also require a decent bandwidth Internet connection to download R and the various R code libraries from CRAN, the main online repository for R packages.
The examples in this book have largely been developed using RStudio version 0.98.1062, with the 64-bit R version 3.1.0 (CRAN distribution), running on a mid-2014 generation Apple MacBook Pro OS X 10.9.4, with a 2.6 GHz Intel Core i5 processor and 16 GB of memory. However, all of these examples should also work with the latest version of R.
Some of the examples in this book will not be able to run with Microsoft Windows, but they should run without problem on variants of Linux. Each chapter will detail any required additional external libraries or runtime system requirements, and provide you with information on how to access and install them. This book's errata section will highlight any issues discovered post publication.
/learn_r_for_applied_statistics_hui_2019.jpg)
Learn R for Applied Statistics - Eric Goh Ming Hui
This book is primarily targeted to programmers or learners who want to learn R programming for statistics. This book will cover using R programming for descriptive statistics, inferential statistics, regression analysis, and data visualizations.
In this book, you will use R for applied statistics, which can be used in the data understanding and modeling stages of the CRISP DM (data mining) model. Data mining is the process of mining the insights and knowledge from data. R programming was created for statistics and is used in academic and research fields. R programming has evolved over time and many packages have been created to do data mining, text mining, and data visualizations tasks. R is very mature in the statistics field, so it is ideal to use R for the data exploration, data understanding, or modeling stages of the CRISP DM model.
/r_in_a_nutshell_2_ed_adler_2012.jpg)
R in a Nutshell, 2nd Ed - Joseph Adler
It’s been over 10 years since I was first introduced to R. Back then, I was a young product development manager at DoubleClick, a company that sold advertising software for managing online ad sales. I was working on inventory prediction: estimating the number of ad impressions that could be sold for a given search term, web page, or demographic characteristic. I wanted to play with the data myself, but we couldn’t afford a piece of expensive software like SAS or MATLAB. I looked around for a little while, trying to find an open-source statistics package, and stumbled on R. Back then, R was a bit rough around the edges and was missing a lot of the features it has today (like fancy graphics and statistics functions). But R was intuitive and easy to use; I was hooked. Since that time, I’ve used R to do many different things: estimate credit risk, analyze baseball statistics, and look for Internet security threats. I’ve learned a lot about data and matured a lot as a data analyst.
R, too, has matured a great deal over the past decade. R is used at the world’s largest technology companies (including Google, Microsoft, and Facebook), the largest pharmaceutical companies (including Johnson & Johnson, Merck, and Pfizer), and at hundreds of other companies. It’s used in statistics classes at universities around the world and by statistics researchers to try new techniques and algorithms.
/domain_specific_languages_in_r_mailund_2018.jpg)
Domain-Specific Languages in R - Thomas Mailund
This book introduces embedded domain-specific languages in R. The term domain-specific languages, or DSL, refers to programming languages specialized for a particular purpose, as opposed to general-purpose programming languages. Domain-specific languages ideally give you a precise way of specifying tasks you want to do and goals you want to achieve, within a specific context. Regular expressions are one example of a domain-specific language, where you have a specialized notation to express patterns of text. You can use this domain-specific language to define text strings to search for or specify rules to modify text. Regular expressions are often considered very hard to read, but they do provide a useful language for describing text patterns. Another example of a domain-specific language is SQL—a language specialized for extracting from and modifying a relational database. With SQL, you have an expressive domain-specific language in which you can specify rules as to which data points in a database you want to access or modify.
/glubokoe_obuchenie_s_r_i_keras_2_izd__JhMmxhP.jpg)
Глубокое обучение с R и Keras. 2 изд - Франсуа Шолле
Прочитав эту книгу, вы получите четкое представление о том, что такое глубокое обучение, когда его следует применять и каковы его ограничения. Авторы описывают стандартный рабочий процесс поиска решения задачи машинного обучения и рассказывают, как устранять часто возникающие проблемы. Всесторонне рассматривается использование Keras для решения самых разнообразных прикладных задач, в числе которых классификация и сегментация изображений, прогнозирование временных рядов, классификация текста, машинный перевод, генерация текста и многое другое.
Издание адресовано читателям со средними навыками программирования на R. Опыт работы с Keras, TensorFlow или моделями глубокого обучения не требуется.
/r_kniga_receptov_long_2020.jpg)
R. Книга рецептов - Джей Ди Лонг, Пол Титор
Язык R – мощный инструмент статистического программирования, десятки тысяч людей ежедневно используют его для проведения серьезного статистического анализа. Но не все задачи, даже простые, удастся быстро решить с его помощью, если не знать определенных тонкостей.
Эта книга предлагает практические советы по решению разнообразных задач с подробным разбором каждой из них. От основных задач автор переходит к вводу и выводу, общей статистике, графике, линейной регрессии – любая значительная работа с R подразумевает знакомство с большинством этих областей или с ними всеми.
Издание пригодится для разработчиков на R с разным уровнем подготовки – от новичков до уверенных пользователей, желающих расширить свой кругозор.
/biostatistical_design_and_analy_Bdge8ia.jpg)
Biostatistical Design and Analysis Using R - Murray Logan
R is a powerful and flexible statistical and graphical environment that is freely distributed under the GNU Public Licencea for all major computing platforms (Windows, MacOSX and Linux). This open source licence along with a relatively simple scripting syntax has promoted diverse and rapid evolution and contribution. As the broader scientific community continues to gain greater instruction and exposure to the overall project, the popularity of R as a teaching and research tool continues to accelerate.
It is now widely acknowledged that R proficiency as a scientific skill set is becoming increasingly more desirable and useful throughout the scientific community. However, as with most open source developments, the emphasis of the R project remains on the expansive development of tools and features. Applied documentation still remains somewhat sparse and somewhat incomprehensible to the average biologist. Whilst there are a number of excellent texts on R emerging, the bulk of these texts are devoted to the R language itself. Any featured examples therein are used primarily for the purpose of illustrating the suite of commonly used R features and procedures, rather than to illustrate how R can be used to perform common biostatistical analyses.
Coinciding with the increasing interest in R as both a learning and research tool for biostatistics, has been the success of a relatively new major biostatistics textbook (Quinn and Keough, 2002). This text provides detailed coverage of most of the major statistical concepts and tests that biologists are likely to encounter with an emphasis on the practical implementation of these concepts with real biological data. Undoubtedly, a large part of the appeal of this book is attributable to the extensive use of real biological examples to augment and reinforce the text. Furthermore, by concentrating on the information biologists need to implement their research, and avoiding the overuse of complex mathematical descriptions, the authors have appealed to those biologists who don’t require (or desire) a knowledge of performing or programming entire analyses from scratch. Such biologists tend to use statistical software that is already available and specifically desire information that will help them achieve reliable statistical and biological outcomes. Quinn and Keough (2002) also advocate a number of alternative texts that provide more detailed coverage of specific topics and that also adopt this real example approach.
/beginning_r_gardener_2012.jpg)
Beginning R - Mark Gardener
This book is for anyone who needs to analyze any data, whatever their discipline or line of work. Whether you are in science, business, medicine, or engineering, you will have data to analyze and results to present. R is powerful and flexible and completely cross-platform. This means you can share data and results with anyone. R is backed by a huge project team, so being free does not mean being inferior!
If you are completely new to R, this book will enable you to get it and start to become familiar with it. There is no assumption that you know anything about the program to begin with. If you are already familiar with R, you will find this book a useful reference that you can call upon time and time again; the first chapter is largely concerned with installing R, so you may want to skip to Chapter 2.
This book is not about statistical analyses, so some familiarity with basic analytical methods is helpful (but not obligatory). The book deals with the means to make R work for you; this means learning the language of R rather than learning statistics. Once you are familiar with R you will be empowered to use it to undertake a huge variety of analytical tasks, more than can be conveniently packaged into a single book. R also produces presentation-quality graphics and this book leads you through the complexities of that.
/analiz_povedencheskih_dannyh-n_nwUe0hh.jpg)
Анализ поведенческих данных на R и Python - Флоран Бюиссон
Задействуйте всю мощь поведенческих данных в своей компании, используя инструменты, специально разработанные для их анализа. Автор, эксперт в области экономики и бихевиористики, показывает, как повысить ценность и результаты аналитических проектов за счет понимания того, что движет поведением людей. Практическая часть книги содержит полные примеры и упражнения на языках R и Python, которые помогут вам получать более глубокую информацию о данных.
Издание предназначено для бизнес-аналитиков и других специалистов, исследующих данные и владеющих программированием на R или Python. Для чтения требуется минимальное знакомство с линейной и логистической регрессией.